      id  gender   age  hypertension  heart_disease ever_married  \
0   9046    Male  67.0             0              1          Yes
1  51676  Female  61.0             0              0          Yes
2  31112    Male  80.0             0              1          Yes
3  60182  Female  49.0             0              0          Yes
4   1665  Female  79.0             1              0          Yes

       work_type Residence_type  avg_glucose_level   bmi   smoking_status  \
0        Private          Urban             228.69  36.6  formerly smoked
1  Self-employed          Rural             202.21   NaN     never smoked
2        Private          Rural             105.92  32.5     never smoked
3        Private          Urban             171.23  34.4           smokes
4  Self-employed          Rural             174.12  24.0     never smoked

   stroke
0       1
1       1
2       1
3       1
4 1 Stroke Prediction Based on Demographics and Medical History
INFO 511 - Fall 2024 - Final Project
Introduction
Strokes can be a deadly medical condition, and even if the patient survives there can be life long consequences as a result of the stroke.
This is why we wanted to look into a dataset that may allow us to help predict the risk factors that cause a stroke.
Dataset
- The dataset used is from a study published in China in 2020.
- It represents a case group of individuals who had a stroke, and a control group of those who did not.
Data
- Observations include age, gender, marital status, and employment status, as well as medical information such as BMI, glucose levels, smoking history, etc.
Data
- Qualitative variables: gender, smoking status, employment status, marital status.
- Quantitative variables: age, BMI, glucose index.
<class 'pandas.core.frame.DataFrame'>
RangeIndex: 5110 entries, 0 to 5109
Data columns (total 12 columns):
 #   Column             Non-Null Count  Dtype
---  ------             --------------  -----
 0   id                 5110 non-null   int64
 1   gender             5110 non-null   object
 2   age                5110 non-null   float64
 3   hypertension       5110 non-null   int64
 4   heart_disease      5110 non-null   int64
 5   ever_married       5110 non-null   object
 6   work_type          5110 non-null   object
 7   Residence_type     5110 non-null   object
 8   avg_glucose_level  5110 non-null   float64
 9   bmi                4909 non-null   float64
 10  smoking_status     5110 non-null   object
 11  stroke             5110 non-null   int64
dtypes: float64(3), int64(4), object(5)
memory usage: 479.2+ KB
None
Visualization for Stroke Distribution
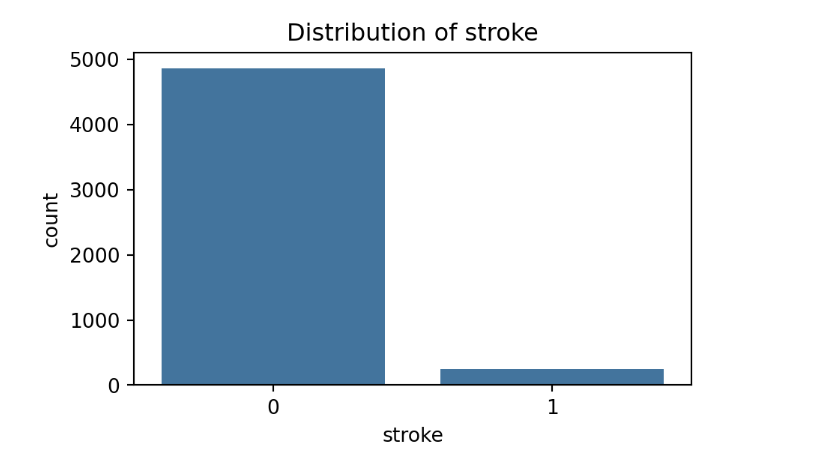
- Across the population, there is a higher proportion of people who do not suffer from stroke as compared to those who do suffer from stroke.
Visualization for Gender Distribution
- As for gender analysis, there is a higher proportion of females as compared to males surveyed.

Visualization for Residence Type Distribution
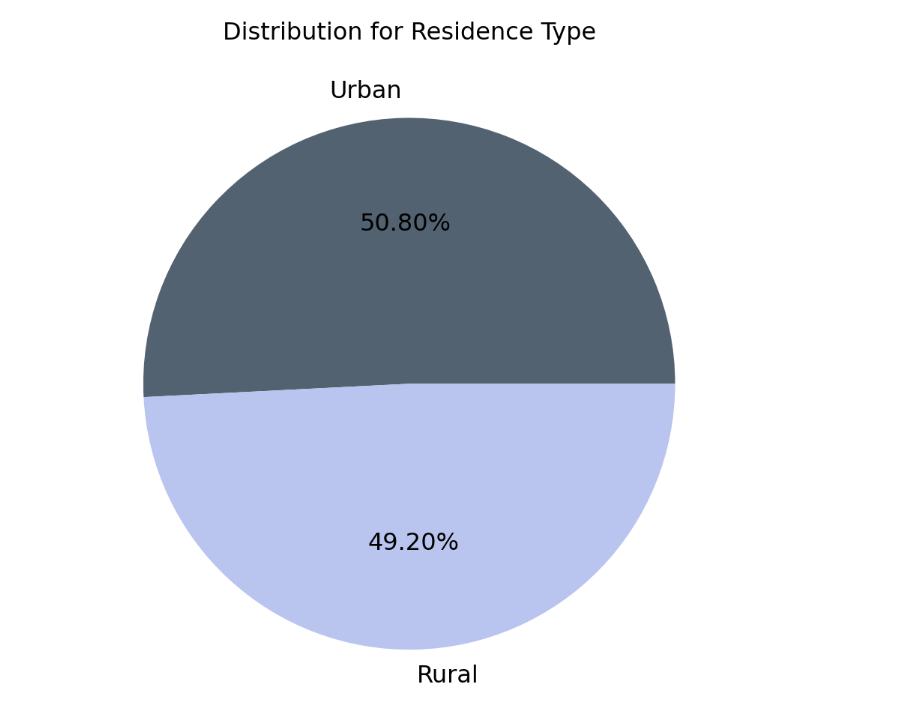
- In terms of residence type, the distribution for rural vs urban are highly equivalent.
Visualization for Marital Status Distribution
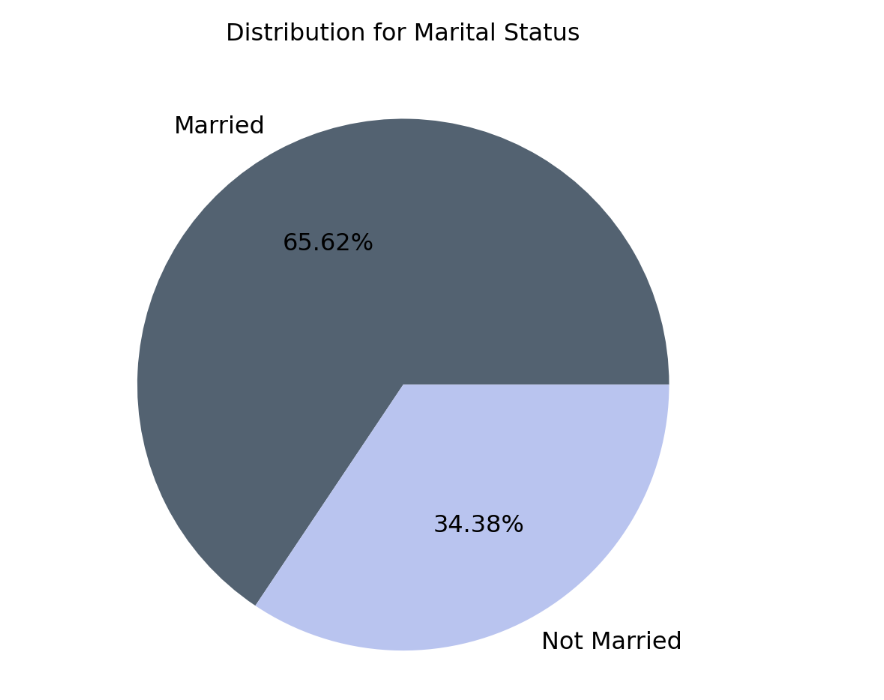
- As for marital status, there is a higher proportion of people surveyed who are married, as compared to those who are not married.
Visualization for Work Type Distribution
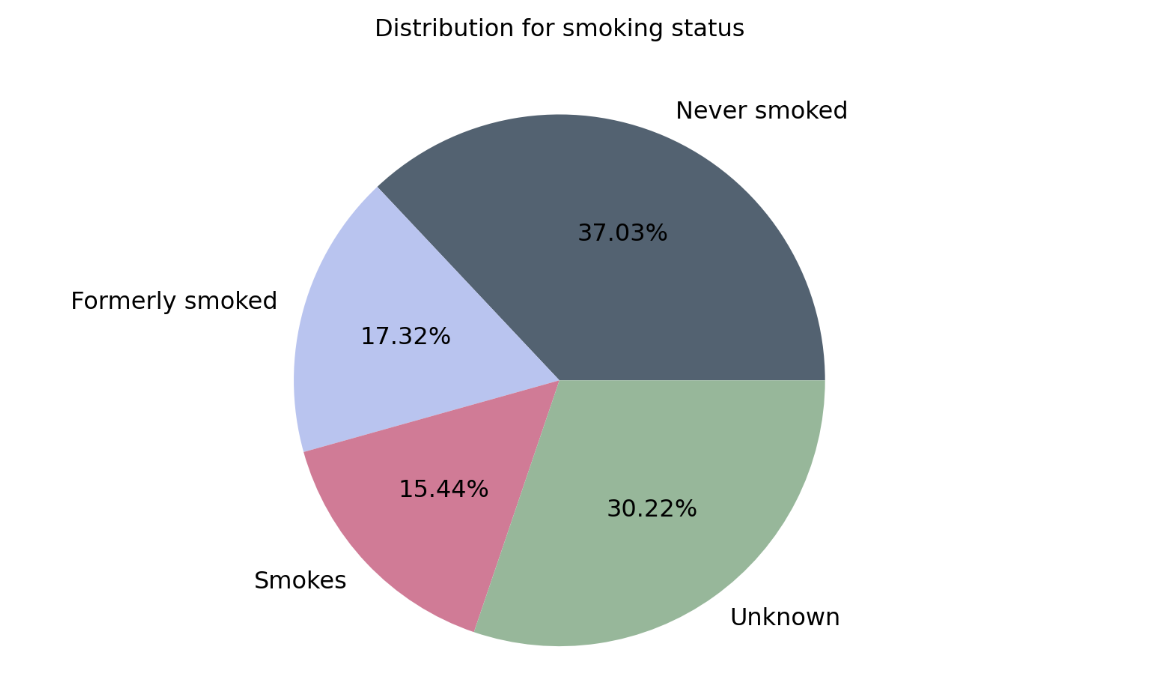
Visualization for Smoking Status Distribution
Methods and Results
Exploratory Data Analysis
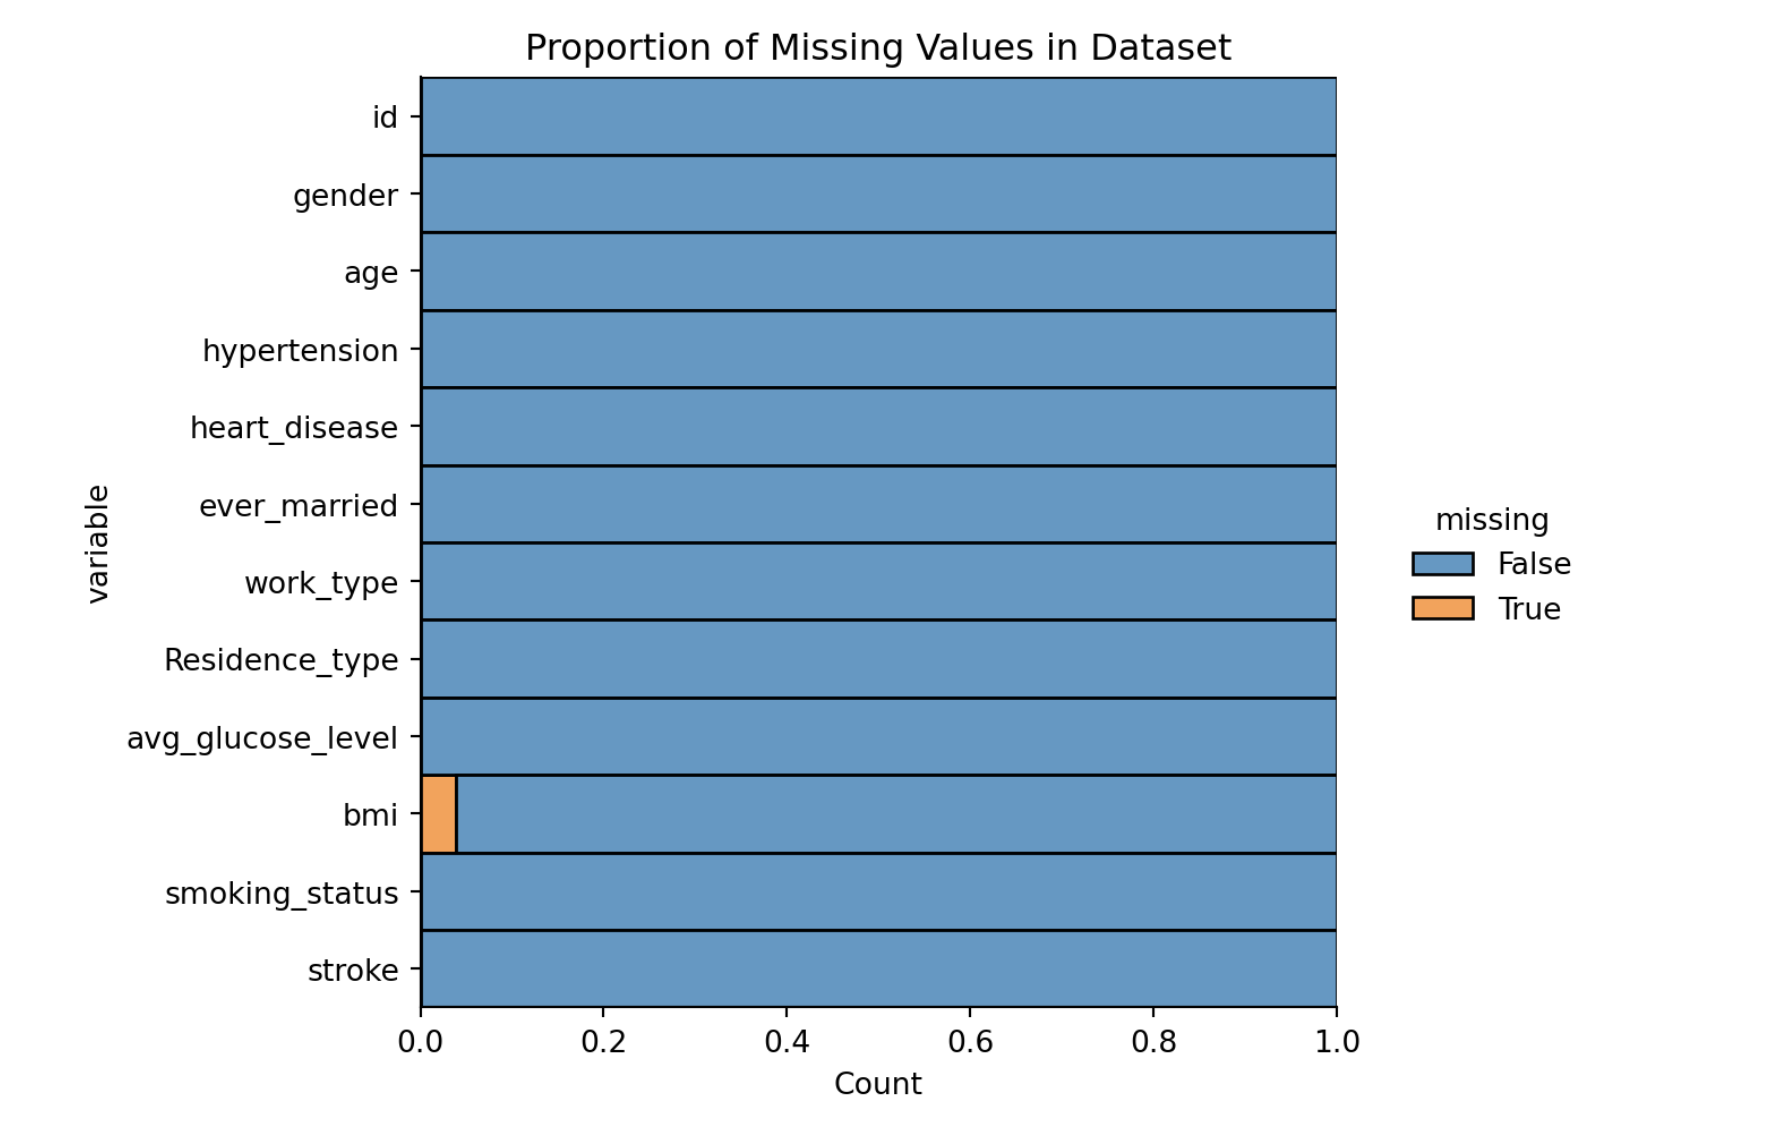
- Missing values were dropped from the dataset.
- Categorical variables were transformed into factors.
Variable Correlation Heatmap
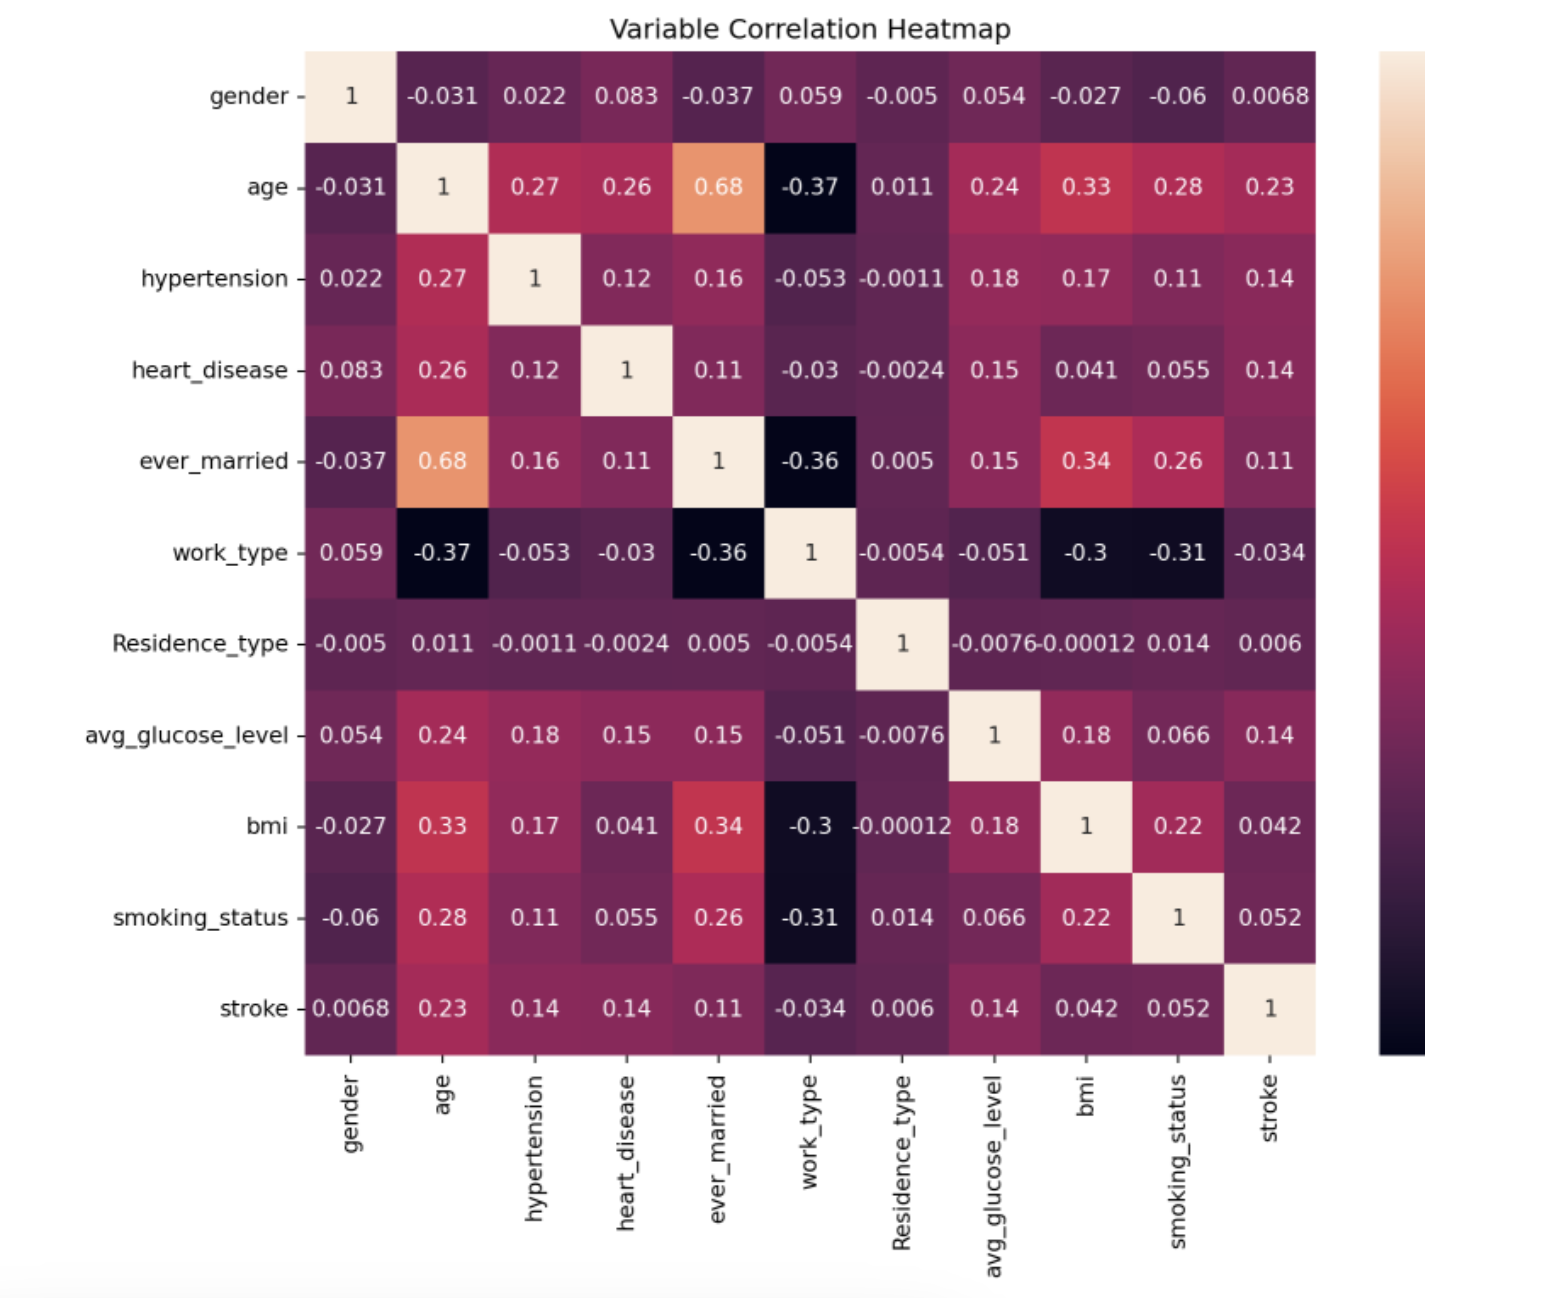
- The correlation matrix of all variables, other the ID, is displayed on the heatmap.
Machine Learning
- After preparing the dataset, we split it into training (80%) and testing (20%) sets.
- We trained 5 different machine learning models on this dataset: Random Forest, Decision Tree, Support Vector Machine (SVM), Artificial Neural Network (ANN), Logistic Regression.
- To evaluate the performance of these models, we employed 5-fold cross-validation.
Results

Model Performance Evaluation
- If model simplicity, speed, and interpretability are essential, Logistic Regression is an excellent option.
- However, if model robustness and predictive power are the priority, Random Forest would be the better choice.
Conclusion
Summary
There was not a particularly strong correlation between the stroke outcome and the covariates listed in the dataset.
The strongest correlation to a stroke outcome was with age at 0.23.
Other notable correlations to a stroke outcome were hypertension, heart disease and glucose level, all at 0.14.
Conclusion
- It appears that the strongest correlations to a stroke outcome occur with participants’ physical properties rather than their demographics or living status.
- The model results show that individuals in this dataset could be classified by their stroke outcome based on the covariates age, gender, marital status, and employment status, BMI, glucose levels, and smoking history with a high degree of accuracy.
- Since there did not appear to be a particularly strong correlation to any one covariate, it was likely a combination of these factors associated with a stroke outcome.
Future work
To increase the population of people being surveyed as one of the limitations we encountered with this dataset is that there was actually a very small proportion of people who had a stroke compared to those that did not: 4.87% (N=249) of individuals had a stroke, while 95.1% (N=4861) did not.
This created an unequal distribution within both the training and testing dataset, which may have artificially boosted the classification accuracy.
Future work
To increase the diversity of the population of people being surveyed as the context upon which the study was conducted was not able to return insights that we could consider to be generalizable across the general public internationally.
The dataset was from a study that was conducted in China, with the population studied mainly being the Chinese population. As such, observations gathered from the study would be considered more applicable towards the Asian population instead of the international population.
References
- 2020: Pathan, Muhammad Salman & Zhang, Jianbiao & John, Deepu & Nag, Avishek & Dev, Soumyabrata. (2020). Identifying Stroke Indicators Using Rough Sets. IEEE Access. 8. 10.1109/ACCESS.2020.3039439